Mastering Football with Player Positioning & xG Analytics
Unlock modern football strategy. Our guide to player positioning & xG analytics reveals how data transforms team tactics and sharpens betting insights.
Welcome to the new era of football, where matches are often decided long before the final whistle—in the realm of data. The idea behind it all is simple, yet incredibly powerful: by combining player positioning with Expected Goals (xG) analytics, you get a far deeper insight into a team's real performance. This combination is the secret language that top clubs and sharp bettors are using to get a serious edge.
The Hidden Data Revolutionising Modern Football

The old-school ‘eye test’ just doesn’t cut it anymore if you want to truly understand the beautiful game. A spectacular goal or a last-ditch tackle will always grab the headlines, but the real story often unfolds in the subtle movements and positioning that happen seconds before the big moment. This is where a smarter approach becomes essential, both for tactical analysis and for betting.
Imagine the football pitch as a giant chessboard. Each player’s position isn't just about where they’re standing; it’s a strategic choice that defines their influence on the match. A striker is infinitely more dangerous receiving the ball in the six-yard box than on the halfway line. That simple truth is the bedrock of player positioning & xG analytics.
Moving Beyond Simple Statistics
For decades, we relied on basic stats like shots on target and possession percentage. They have their place, but these numbers often paint a misleading picture. A team can hog 70% possession but create next to no genuine scoring opportunities. On the flip side, another team might only muster a few shots, but if they're all from prime locations, they’re far more likely to win.
This is where fusing positioning with xG brings clarity. By analysing where players are on the pitch when they shoot, we can finally measure the quality of the chances they create. It helps us see past flattering scorelines and spot the teams that are performing much better—or worse—than their results let on.
"Data analytics in football isn't about replacing intuition; it's about sharpening it. Understanding where high-quality chances are created gives you a predictive power that surface-level stats can't match."
The Advantage for Bettors and Fans
Learning to read this hidden data gives you a massive advantage. Instead of just reacting to a team's recent wins or losses, you can identify the underlying performance trends that the rest of the market has probably missed. This guide will show you exactly how to:
- See the tactical patterns that truly decide who wins and loses.
- Identify teams that consistently create high-quality chances through smart positioning.
- Predict future success by focusing on sustainable performance, not just luck.
By the time we're done, you'll see why the most successful clubs and bettors look at the pitch not just as a field of play, but as a dynamic map of opportunities.
Decoding xG and Positional Data
To get a real edge in today's game, you need to get your head around two of the most powerful tools in modern football analysis. The first is Expected Goals (xG). Think of it as a quality score for every single shot taken during a match. It goes far beyond the simple "on target" or "off target" stats, giving you a much richer story of what actually happened on the pitch.
An xG value for any given shot will fall somewhere between almost zero (a speculative punt from the halfway line) and nearly 1.00 (a sitter from two yards out). This number isn't just pulled out of thin air; it’s calculated by comparing a shot to thousands of similar historical attempts, factoring in everything from the distance and angle to goal, to whether it was a header or taken with a player's foot. In short, xG tells you about the quality of chances a team is creating, not just how many goals they happen to score.
This simple chart shows just how much location matters.
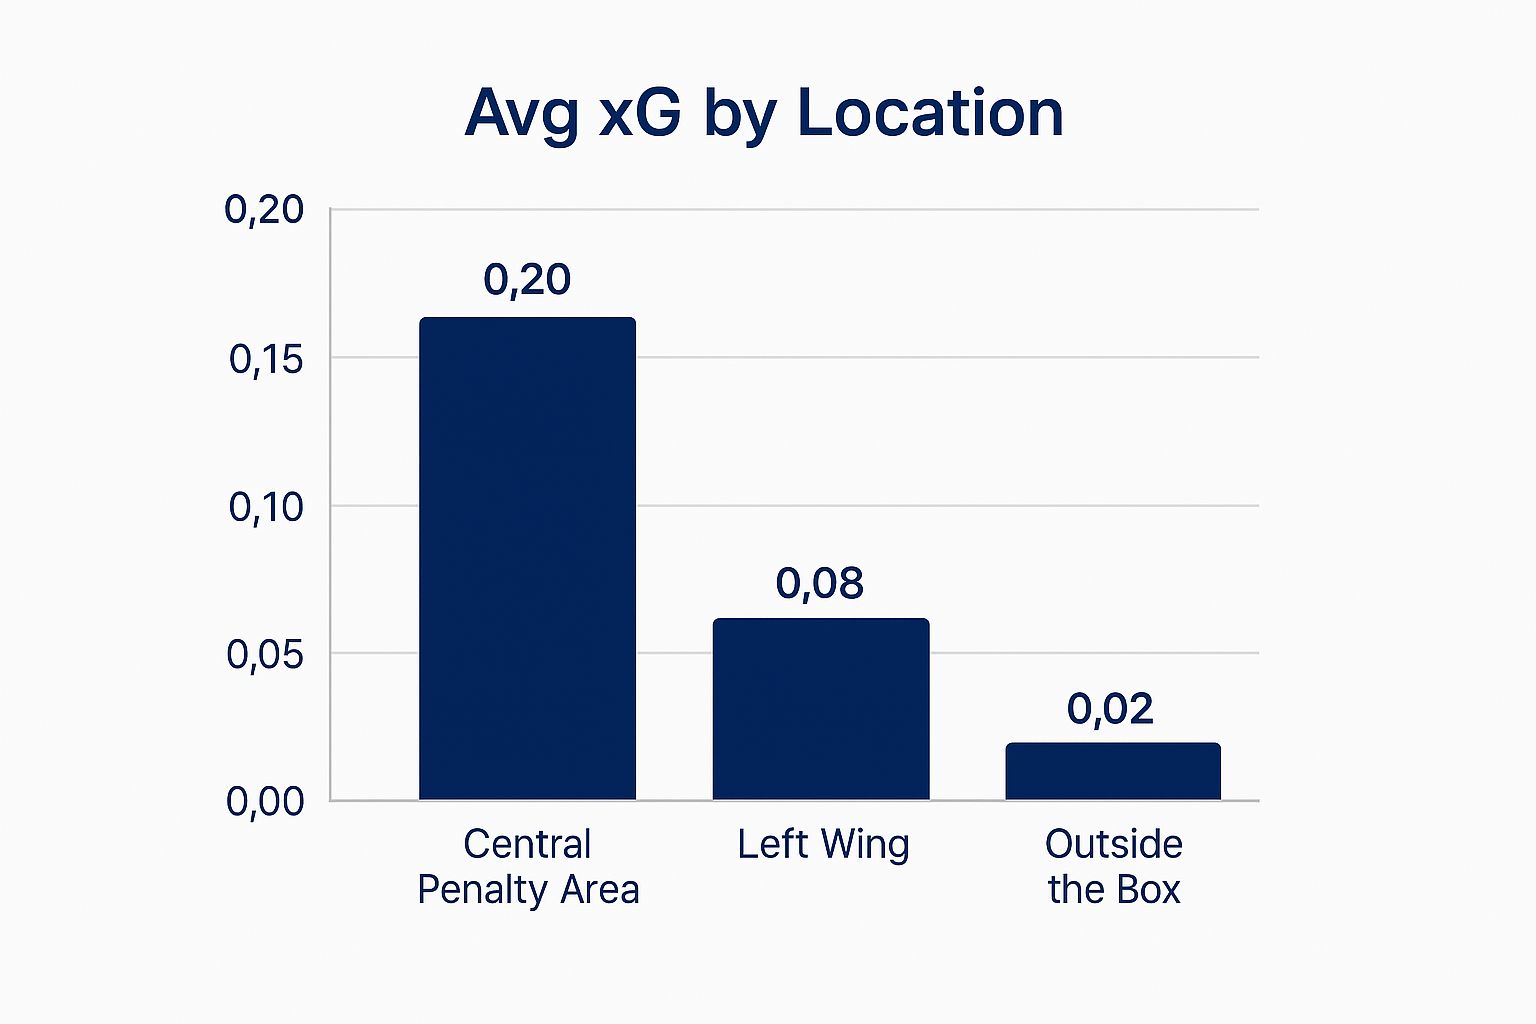
It’s pretty clear, isn't it? A shot from the heart of the penalty area is literally ten times more likely to end up in the back of the net than one from outside the box. This single insight is the bedrock of so much modern tactical thinking.
To truly appreciate what drives these xG values, it helps to see how different factors come into play.
Understanding xG Shot Values
| Shot Type | Example Scenario | Typical xG Value Range |
|---|---|---|
| High-Value Chance | A striker receives a cut-back pass with only the goalkeeper to beat, shooting from the penalty spot. | 0.35 - 0.75+ |
| Average Chance | A winger cuts inside and shoots from just inside the corner of the 18-yard box, with a defender partially blocking the angle. | 0.08 - 0.15 |
| Low-Value Chance | A defender attempts a header from a corner kick, under pressure from two opponents near the edge of the six-yard box. | 0.04 - 0.09 |
| Very Low-Value Chance | A midfielder tries a long-range shot from 30 metres out, with several defenders between them and the goal. | 0.01 - 0.03 |
As the table shows, not all shots are created equal. The context—the where, the how, and the who—is everything when it comes to judging the true quality of an attack.
The Importance of Positional Data
So, if xG measures the quality of the final shot, positional data is what tells us how that chance came to be in the first place. This data is the secret sauce, captured by sophisticated tracking systems that follow every single player’s movement for the full 90 minutes, whether they have the ball or not.
This isn't just about where a player is when they shoot. It’s about the clever runs that drag defenders out of shape, the occupation of those dangerous pockets of space between the midfield and defence, and the disciplined structure that chokes off an opponent's access to high-xG areas. Positional data provides the tactical context behind the numbers.
By combining player positioning & xG analytics, you move from simply asking "Who scored?" to understanding "How and why was that goal-scoring opportunity created?" This is the key to predicting future performance.
The link between a player's position and their chance of scoring is undeniable. Just look at the data from Liga I matches. Shots taken from within 12 metres of the goal have a massive conversion probability, sometimes as high as 35%. Compare that to pot-shots from outside the area, which find the net less than 7% of the time. You can dive into more detailed Liga I team stats and see for yourself how the top teams consistently engineer chances in these high-value zones.
Ultimately, think of it this way: xG tells you what happened in terms of chance quality, while positional data explains why it happened. One is a great tool, but it only tells half the story. Put them together, and you have a powerful lens for dissecting team performance, spotting tactical mismatches, and finding those smarter betting angles that most people will completely miss.
How Player Positioning Creates High-Value Chances

A team’s Expected Goals (xG) figure isn’t just a jumble of random shot values. It’s the end product of deliberate, coordinated movement off the ball. Think of it less as a fluke and more as a well-rehearsed play. What players do before they get the ball is often what truly engineers a golden opportunity.
The top teams know exactly where the most valuable real estate on the pitch is: that central slice of turf right in front of the goal, what many call the 'danger zone'. A shot from here is worth its weight in gold. So, a team’s entire attacking philosophy is often built around one simple question: how do we get our best finisher on the ball, with a bit of time and space, right there? This is where tactical nous and cold, hard data collide.
The Art of Creating Space
The most devastating attacking moves are rarely a straight line from A to B. They’re all about smart positioning designed to pull a well-drilled defence apart at the seams. A huge part of modern player positioning & xG analytics is about recognising how the best teams manufacture these gaps.
It often comes down to a few key tactics:
- Occupying the Half-Spaces: You’ll see forwards or attacking midfielders drift into those awkward channels between the opposition’s full-backs and centre-backs. This causes chaos and forces a defender into a horrible choice: follow the runner and leave a hole, or stick to your position and let a killer pass slide through.
- Decoy Runs: A winger might suddenly burst down the touchline, dragging a defender or two with them. The run isn't always about getting the ball themselves; it’s about creating a gaping hole in the middle for a striker to charge into. It's selfless, but incredibly effective.
- Third-Man Runs: This is a classic move for a reason. Player A passes to Player B, who immediately lays it off for Player C, who has timed a run from deep. The runner arrives in the box like a ghost, often unmarked, to meet the ball for a prime scoring chance.
A team can have just 35% possession and still completely dominate the xG battle. This isn't magic. It happens when their movement is so clinical that every attack is designed to end in a high-value shot, while their own defensive shape forces the other team to shoot from hopeless positions.
From Positioning to xG Dominance
Picture a textbook counter-attack. It’s not just about raw pace; it's about structured, intelligent movement. The second the ball is won back, the forwards are already making synchronised runs. One might sprint wide to stretch the last defenders, while another aims for the gap right between the two centre-backs.
Suddenly, the player with the ball has a simple decision, often leading to a one-on-one with the keeper. That’s a chance with a massive xG value, often clocking in at over 0.40.
That entire sequence is built on the foundation of smart positioning. The chance wasn't created by a single moment of magic, but by a pre-drilled tactical pattern. By analysing these movements, we can spot teams whose system consistently generates these high-value chances, making them a solid bet to score plenty of goals over the season. It’s proof that a team’s shape and movement are the real engines behind any lasting attacking success.
Analytics in Action in Romanian Football
Let's bring this all back home and look at Romanian football, which is a fantastic real-world lab for seeing how these data-driven ideas are taking hold. More and more, clubs are waking up to the fact that winning isn't just about passion; it's heavily influenced by the subtle art of player positioning. The days of just 'going with your gut' are fading fast, replaced by a much more calculated approach to manufacturing goals.
You can really see this shift in the way top Liga I teams build their attacks. Take a side like CFR Cluj, for example. Their domestic success hasn't just come from raw talent. It's built on systematically drilling their forwards to get into high-value zones. Their attacking plays are meticulously designed to pull defenders out of position and open up the exact channels that player positioning & xG analytics tell us are the most lethal. It's no longer just about taking a shot; it's about taking the right shot.
From Hagi's Genius to Modern Precision
Think back to a legend like Gheorghe Hagi. His genius was all instinct and magic—a fluid, unpredictable force that could dismantle a defence from anywhere on the pitch. Today’s top players are still incredibly skilful, but they now blend that natural talent with a deep tactical awareness that's sharpened by data. Their movements are often less about spontaneous brilliance and more about the disciplined execution of patterns that stack the statistical odds in their favour.
This modern, more analytical approach has a massive impact. In Romanian football, simply positioning players to create chances in high-xG zones is linked to a 25-30% bump in goal conversion rates. Teams are now deliberately focusing their build-up play on getting players into those dangerous pockets of space inside the opponent's box, a trend directly backed up by the xG data.
The core idea is simple but incredibly powerful: create fewer, better chances. A team generating an xG of 2.5 from just eight shots is far more efficient and dangerous than one that wildly fires off 20 shots for a measly xG of 1.2.
What This Means for Bettors
For bettors, looking at the game through this analytical lens is a huge advantage. When you can analyse a team's positional discipline and the quality of chances they create—not just the quantity—you can see past a misleading final score. A team might lose 1-0, but if they absolutely dominated the xG battle, it suggests they were just unlucky. That same team might be seriously undervalued by the bookies for their next match.
Learning how to put this thinking into practice is the next step, and our guide on AI-powered football betting predictions offers a deeper dive into turning this kind of data into much smarter wagers.
Using Analytics to Find Smarter Betting Angles

Alright, you’ve got the basics of Expected Goals (xG) and positional data down. Now for the fun part: turning that knowledge into a real-world betting advantage. This is where we stop being students of the game and start becoming sharp bettors, spotting the opportunities that casual fans—and even some bookmakers—completely miss.
At its heart, this strategy is all about finding teams whose results don’t tell the whole story. Imagine a team loses 1-0. The headlines will scream "DEFEAT," but what if their xG for the match was a whopping 2.8 against their opponent's tiny 0.4? They didn't lose because they were the worse team; they lost because of some freakish goalkeeping, bad bounces, or just plain old bad luck.
That kind of team is gold dust. The market will likely downgrade them for their next match based on the loss, but we know they were dominant. That’s our cue to pounce.
Spotting Positive and Negative Trends
The true magic of using player positioning & xG analytics isn't about one-off games. It's about spotting patterns over a stretch of matches. You're looking for signs that a team’s luck is about to turn, for better or for worse.
Here are the key signals to hunt for:
- The ‘Buy Low’ Signal: Find teams that are consistently creating more and better chances (high xG) than their opponents but just can't seem to find the back of the net. Their process is sound, they’re just in a finishing slump. Trust me, the goals will come.
- The ‘Sell High’ Signal: Be wary of teams on a hot winning streak who are actually getting lucky. They might be snatching goals from low-probability shots while their opponents are hitting the woodwork. This is a house of cards waiting to fall, and you don’t want to be backing them when it does.
By focusing on the process of creating quality chances, not just the fleeting results, you're investing in a team's sustainable quality. This is how you build a long-term edge and is crucial for accurately tracking units won and lost to see your real profit.
The Tactical Mismatch Advantage
Ready to go a level deeper? Forget just looking at one team in isolation. The real edge comes from comparing two teams' positional data before they even kick off.
Does Team A love to attack down the left wing, creating havoc in that channel? And does their opponent, Team B, happen to concede most of their high-quality chances from that exact same area? Bingo. You've just identified a tactical mismatch that the basic form guide will never show you.
This means you’re no longer just betting on a team to win. You’re betting on a specific, data-backed weakness that is likely to be exploited, leading to a flood of high-xG opportunities. That’s how you find value that nobody else sees.
To put it all together, let’s look at how this data-driven approach stacks up against more traditional thinking.
Betting Signals from xG and Positional Data
| Metric | Traditional View | xG & Positional Analysis View |
|---|---|---|
| Recent Loss | "The team is in poor form, avoid them." | "Did they dominate on xG? If so, they might be undervalued." |
| Winning Streak | "They're on fire! Jump on the bandwagon." | "Are they overperforming their xG? A correction could be imminent." |
| Star Striker | "He scores a lot of goals, so he must be good." | "Where does he score from? Does his positioning match the opponent's weakness?" |
| Strong Defence | "They don't concede many goals." | "Are they lucky? Do they give up lots of high-xG shots but get away with it?" |
| Team Matchup | "Team A has a better head-to-head record." | "Team A's key attacking zone lines up perfectly with Team B's weakest defensive area." |
As you can see, shifting your perspective from simple results to the underlying process opens up a completely new way to analyse football and find truly intelligent bets.
Essential Tools for Your Own Football Analysis
Ready to roll up your sleeves and get into the data yourself? The good news is, you don’t need a PhD in statistics to start finding real, valuable insights. There’s a brilliant selection of publicly available resources that can get you started with player positioning and xG analytics today.
Websites like FBref and Understat are my go-to starting points. They’re absolute goldmines of data for all of Europe's top leagues, offering match reports that dig so much deeper than just the final score. You can see the xG story of every game and visualise exactly how the key moments unfolded.
These platforms let you see the game through the eyes of a professional analyst. You can play around with interactive shot charts that pinpoint where every single attempt was taken from, giving you an instant feel for which teams are consistently getting into those high-value areas close to goal.
Reading the Visual Story
To really get the most out of these tools, you need to know what you’re looking for. I always focus on a couple of key visualisations first:
- Shot Charts: Are there big clusters of high-xG shots right in front of the goal? A team that consistently creates chances from inside the box is doing something right tactically, even if their recent goal tally doesn't show it.
- Player Heatmaps: These maps show you a player's territory. Is that star striker actually getting into dangerous central positions, or is the opposition's defence successfully forcing him out wide where he’s less of a threat?
"The real magic of these tools isn’t just seeing what happened, but understanding the tactical story behind the numbers. A heatmap can tell you more about a team's game plan than a post-match interview ever will."
Looking Beyond the Screen
Of course, analysis isn't all about staring at spreadsheets. When you’re watching a match live, start to actively look for positioning. Keep an eye out for those clever decoy runs that pull defenders out of position and create space for a teammate. Notice how a team’s defensive structure forces attackers to take potshots from distance, racking up low-quality chances.
By blending these free online tools with your own sharp-eyed viewing, you can build a genuinely sophisticated picture of how a team truly performs. It's this very approach that lays the groundwork for more complex analysis, like the kind used in a multi-agent AI betting model, and helps turn a sea of data into clear, actionable ideas for your betting.
Got Questions About xG and Player Positioning? We've Got Answers.
As you start digging into the stats behind player positioning & xG analytics, you’re bound to have questions. It’s a lot to take in at first, so let’s run through some of the most common ones to help build your confidence.
First up, the big one: is xG a perfect metric? In a word, no. It’s an incredibly powerful tool for gauging the quality of a team's chances, but it's not without its blind spots. For instance, most standard xG models won't factor in the exact position of a defender lunging to block a shot or where the goalkeeper is standing.
That means a shot could be given an xG of 0.30, even if a defender made a last-ditch, goal-saving tackle. But here’s the thing: over hundreds of shots, these little discrepancies tend to balance out. The result is still a surprisingly accurate picture of a team's ability to create and prevent quality chances over the long haul.
Are All xG Models the Same?
You might have noticed that xG figures can vary a bit depending on where you look, whether it's FBref, Understat, or Opta. This is a common point of confusion. The reason is simple: each provider uses their own unique model, built on a slightly different dataset of historical shots and weighing factors in their own way.
It’s a bit like different weather apps. They all use similar atmospheric data, but their proprietary models might spit out slightly different temperature forecasts. What's important is to focus on the bigger picture and maintain consistency.
- Small differences are totally normal and don’t mean the metric is broken.
- The overall trends are what really count. If a team is consistently creating better chances than their opponents, that pattern will be clear no matter which provider you use.
- To keep your analysis clean, try to stick with one source so you're always comparing apples to apples.
The real power of xG isn't about predicting a single shot with perfect accuracy. It's about measuring the process. It tells us which teams are doing the hard work of getting into dangerous scoring positions time and time again.
Can Analytics Replace the Scout's Eye?
Finally, people often wonder if a spreadsheet can ever truly replace the "eye test" of a seasoned scout. The truth is, you need both. Data and traditional scouting aren’t rivals; they’re partners.
Data might flag a striker who constantly gets into fantastic positions but can't seem to find the back of the net. That's the "what". A scout's eye can then provide the "why"—maybe he snatches at his chances, lacks composure, or his movement off the ball is predictable. Analytics gives you the objective facts, while scouting gives you the crucial human context.
Ready to turn these advanced insights into confident betting decisions? OddsHaven uses AI to analyse these very metrics, delivering daily high-value picks and parlay suggestions directly to you. Stop guessing and start betting smarter at https://www.oddshaven.ai.
Ready to Start Winning?
Join OddsHaven and get instant access to AI-powered predictions with an 87% win rate on high-confidence picks
Try OddsHaven Free for 5 Days